

Candy Heart Lab
With Valentine’s Day right around the corner, this Candy Heart Dissolving Lab is the perfect hands-on STEM experiment to engage kids while building real science and data skills. This simple, visual experiment explores solubility, lab variables, qualitative vs. quantitative data, and graphing. Best of all, we are using a seasonal favorite, classic conversation hearts! It’s quick to set up, easy to run in groups, and flexible for elementary through middle school classrooms.
Candy Heart Experiment with Data and Graphing
Table of Contents
Disclaimer: This article may contain commission, paid partnerships, or affiliate links. We independently review everything we recommend. When you buy through our links, we may earn a commission from qualifying purchases.
This Valentine’s Day STEM activity combines seasonal fun with real scientific investigation and data skills, and provides some great teaching opportunities. First things first with any experiment: what are we trying to learn?
What Are We Investigating? (Learning Objectives)
Before starting any experiment, students should understand the purpose of the investigation. This lab focuses on solubility and observation skills.
Primary Research Question: Which liquid is most effective at dissolving a candy heart when comparing four different liquids?
Secondary Research Question: Which liquid erases the message on the candy heart the fastest, and which takes the longest?
Materials List
Materials Needed for each group:
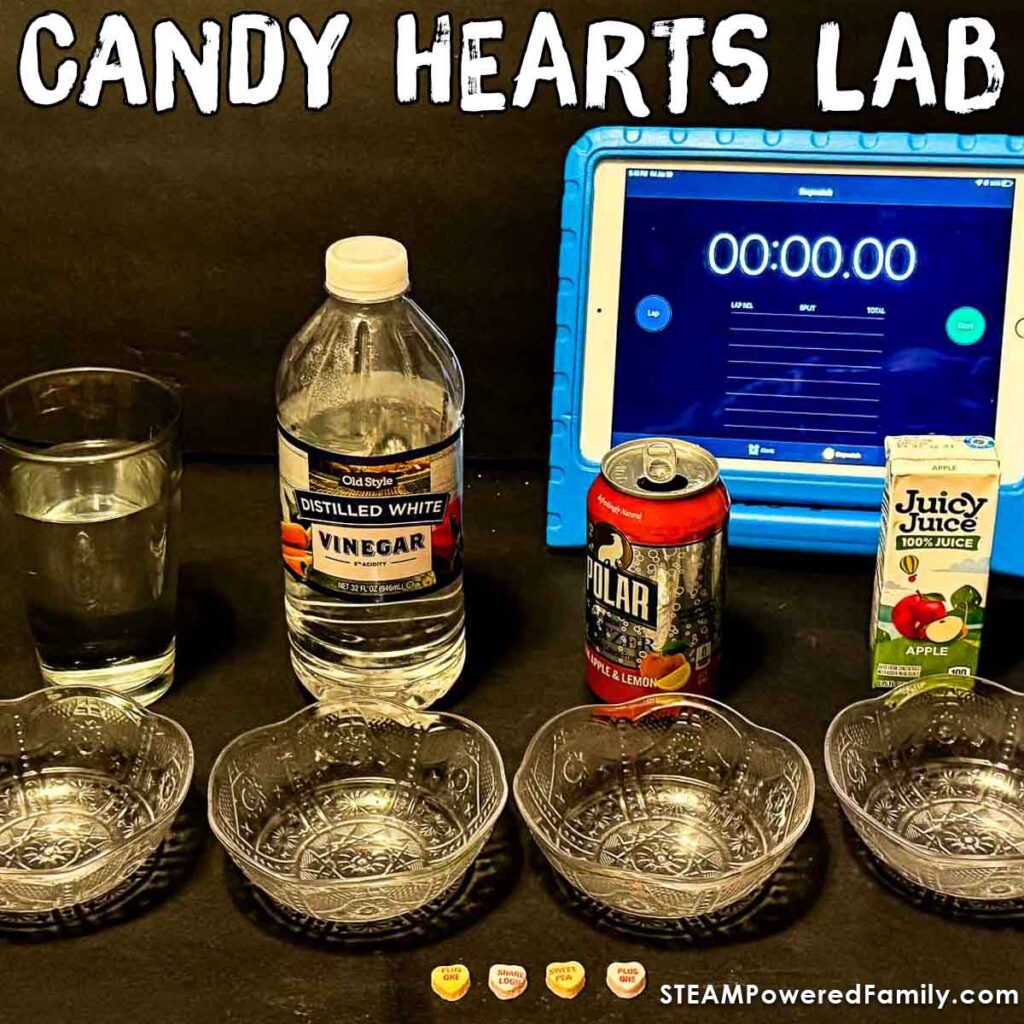
- 4 small clear bowls
- Candy hearts (classic hearts with printed messages)
- 4 room-temperature liquids: Water, Vinegar, Clear soda pop, Fruit juice
- Stopwatch or timer (classroom tablet or phones work well)
- Pencils
- Paper, markers, or colored pencils for graphing
Candy Heart Lab Worksheets
Plus you can use our worksheets to make your prep even faster and easier.
Step-By-Step Directions
Start by dividing your students into small groups. I would recommend 3 to 4 students per group. Then have them decide who is doing which role: time keeper, observer and data recorders.
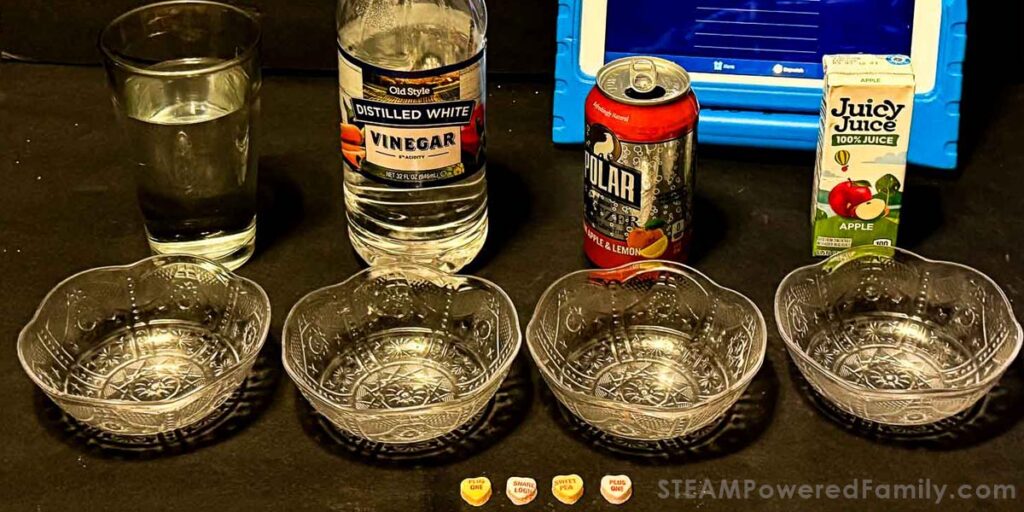
Set up four bowls in front of the students, label them water, vinegar, soda, juice and put the corresponding liquids into each bowl. Ensure your liquids are the same temperature to eliminate temperature as one of the variables.
For extra skill development, set a specific measure of the liquids based on the size of your bowls. For example, one cup. Then have the students measure each liquid before pouring it into the bowl. This again constrains one variable by ensuring there is the same amount in each bowl.
Place a candy heart next to each bowl.
Give each group the recording worksheets and a way to watch the time. This could be stop watches, a tablet or phones.
Predictions and Discussion Prompts
Before starting, ask students:
- Which liquid do you think will dissolve the candy heart the fastest? Why?
- Which liquid will take the longest to erase the message?
- What properties of the liquids might affect solubility?
Start the Experiment
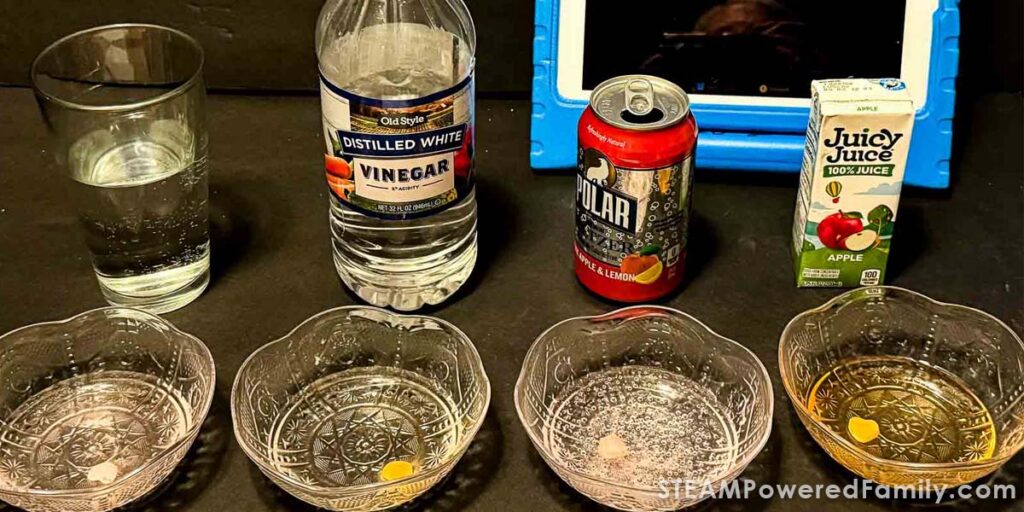
When you’re ready, have the kids drop one heart in one bowl of liquid while someone else starts the clock.
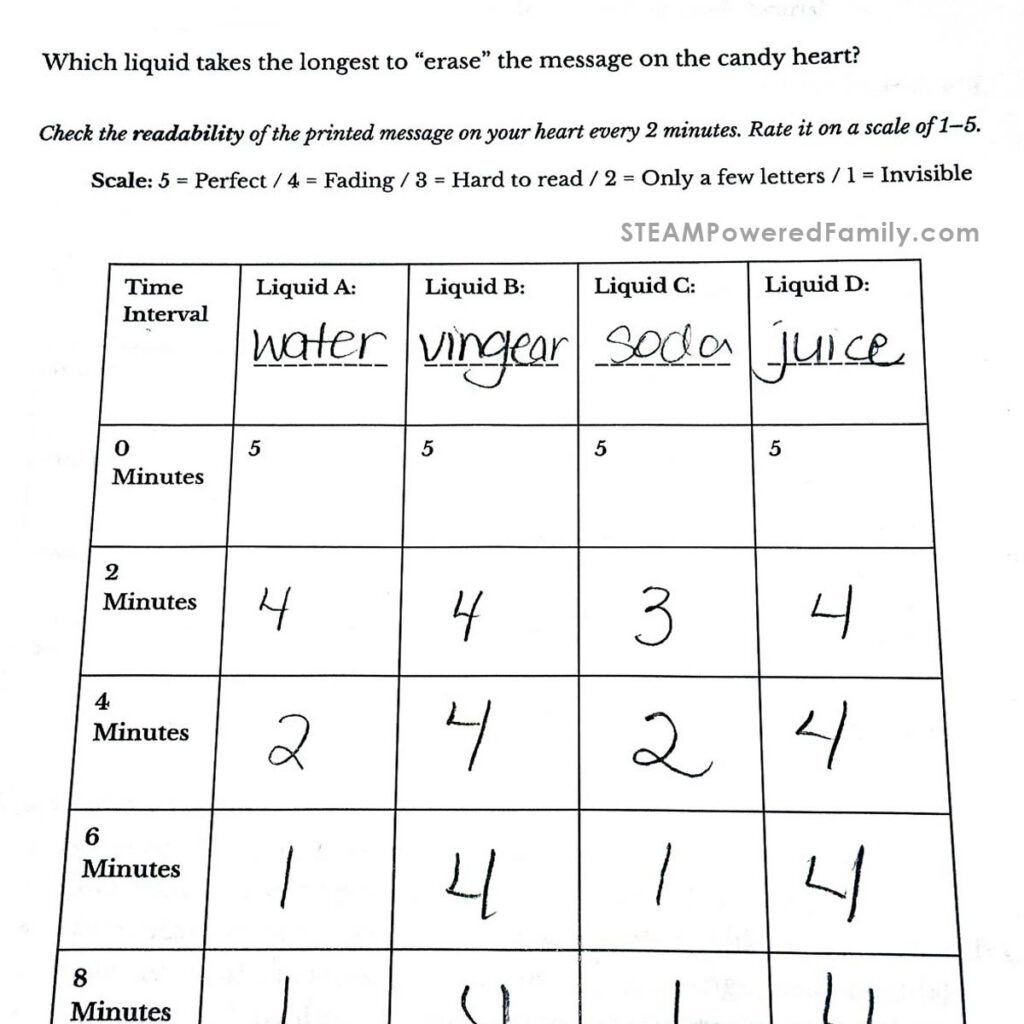
Set timers for every 2 minutes to assign a qualitative number to how visible the messages on the hearts are.
I suggest a time limit on the experiment of about 15 minutes.
Using the Worksheet
There is a 1-5 scale on the worksheet with 5 being very visible and 1 being invisible.
After the time is up, have the students write down their observations about what happened with each liquid. Do all groups have the same results? What other factors could be variables?
The Results – Data and Graphing
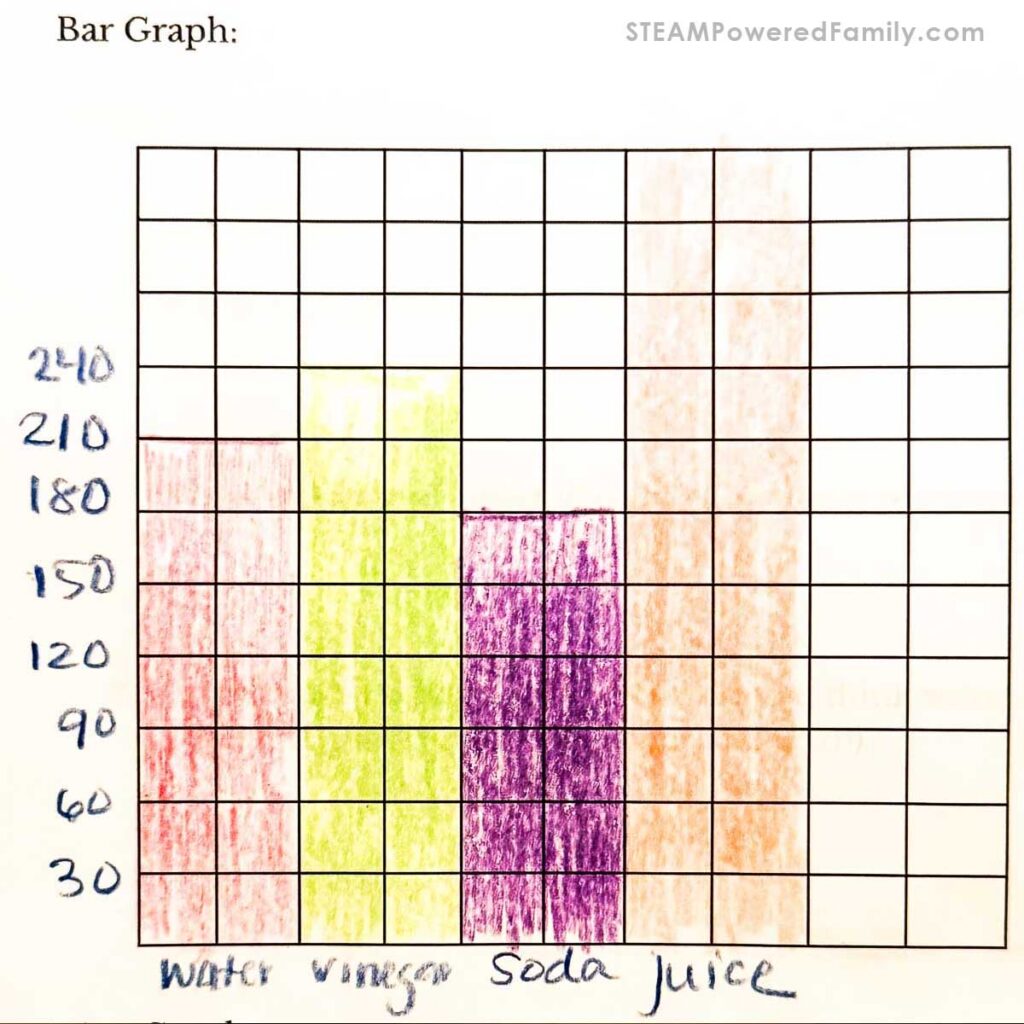
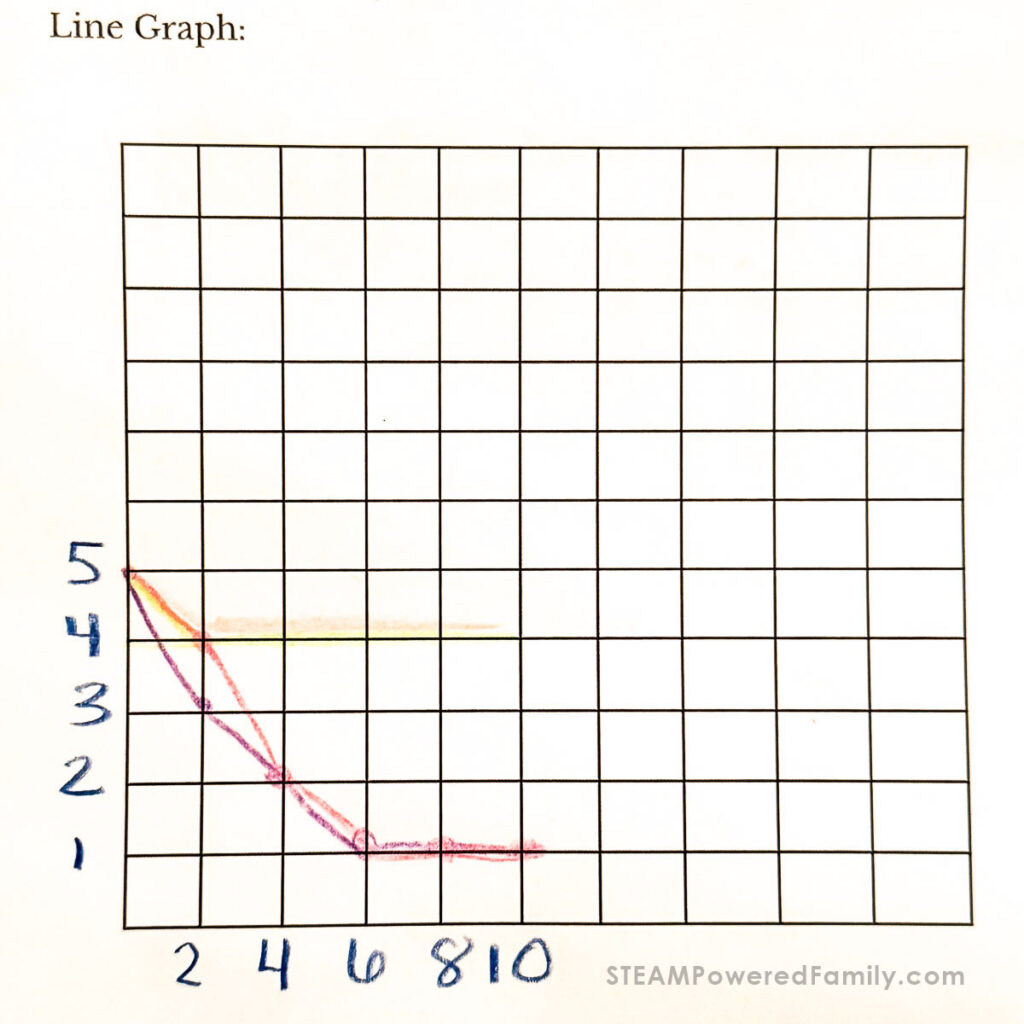
After all of the observations have been made and times recorded this is a great time to show the kids how data can be plotted on a graph. A colorful bar graph would be great for showing the dissolve time. While a line graph would be a great visual for the rate it took the messages to disappear. This will give them a memorable way to remember how graphing works and how data sets work in real life.
To make a bar graph of the solubility you would label the “X Axis” or the bottom of the graph with each of the four liquids. They would label the “Y Axis” with time in minutes, they can count by ones or twos, whichever you prefer. Then they add bars for each liquid showing the time it took to dissolve.
To make the line graph, students will label the “X Axis” with the time intervals (2,4,6,8,10 minutes) and the “Y Axis” with the visibility score (1-5). Use a different color line for each liquid.
What are we Observing?
We are going to observe two different phenomena during this experiment.
First, what liquid dissolves the heart the fastest. This is called measuring the solubility: or the ability to be dissolved.
Second, how long does it take for the message on the candy heart to disappear.
Scientific Vocabulary
Defining Variables
Define variables with your students to build scientific vocabulary.
This lab provides an excellent opportunity to introduce experimental variables:
- Independent Variable: The type of liquid used
- Dependent Variable: The time it takes for the candy heart to dissolve and the message to disappear
- Controlled Variables: Liquid temperature, candy type, bowl size, and starting time
We have independent variables which is the factor that you change, in our case it’s the liquids.
We will also be looking at the dependent variable, which is the thing that we will measure or observe. In this experiment our dependent variable is the time it takes for the heart to disappear.
We also want to make sure we have controlled variables, by that we mean we want the liquids all at the same temperature to be sure that conflicting heat or cold don’t play a role in the rate of dissolving for this particular experiment.
Qualitative vs Quantitative
This is also a great teaching moment for quantitative versus qualitative data in an experiment.
This experiment naturally introduces both types of scientific data:
- Quantitative Data: Numerical measurements, such as time in minutes
- Qualitative Data: Observations like fading letters, color changes, or texture
A helpful memory trick for students:
Quantitative = quantity | Qualitative = quality
Quantitative data is what can be written down, like our measurements of time.
Qualitative data is when you’re watching for something like letters disappearing or how something looks or smells.
Candy Heart Lab FAQ
This activity works well for grades 3–7 and can be simplified or extended as needed.
Vinegar is acidic, which can speed up the breakdown of sugar compared to neutral liquids like water.
Yes! Milk, saltwater, or warm water make great extensions.
Extension Ideas and Cross Curricular Ideas
Math: Calculate averages across groups
Science: Discuss acidity, saturation, and molecular motion
ELA: Write a lab conclusion paragraph
Art: Create colorful graphs and data posters
Our Candy Heart Lab covers some great “lab” skills in a fun and visual way, which is truly one of the best ways to get your students to retain the information. They may not always remember the things you say or what they read, but when children have the opportunity to work hands on and observe and make real world connections it makes for some pretty amazing learning! Happy Valentine’s Day! I hope your students love this as much as mine did!